Market Opportunities
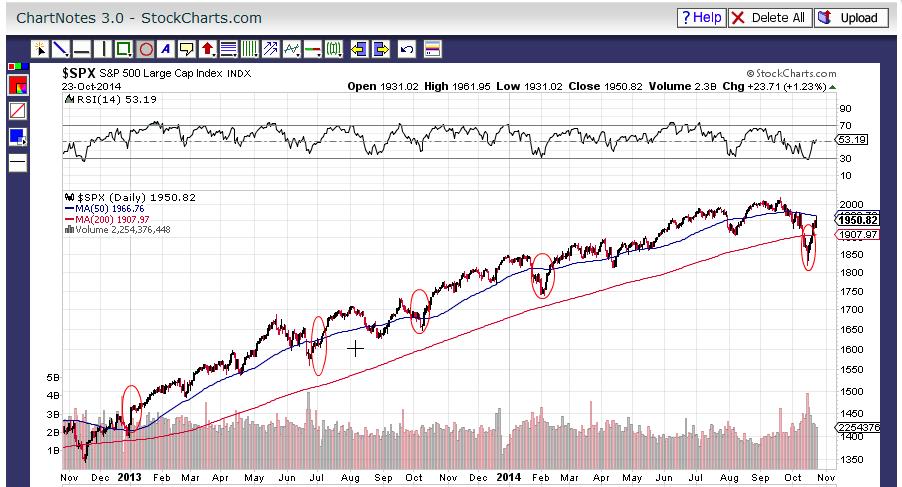
What a difference a week makes! The S&P 500 Index closed today at 1950.82 which is just over 130 points higher than the low established last week. With today’s close, the S&P has closed positive on 5 out of the last 6 days. Plus, the S&P broke significantly above the 200 day moving average on Tuesday and is now above the 20 day moving average as it approaches the 50 day moving average.
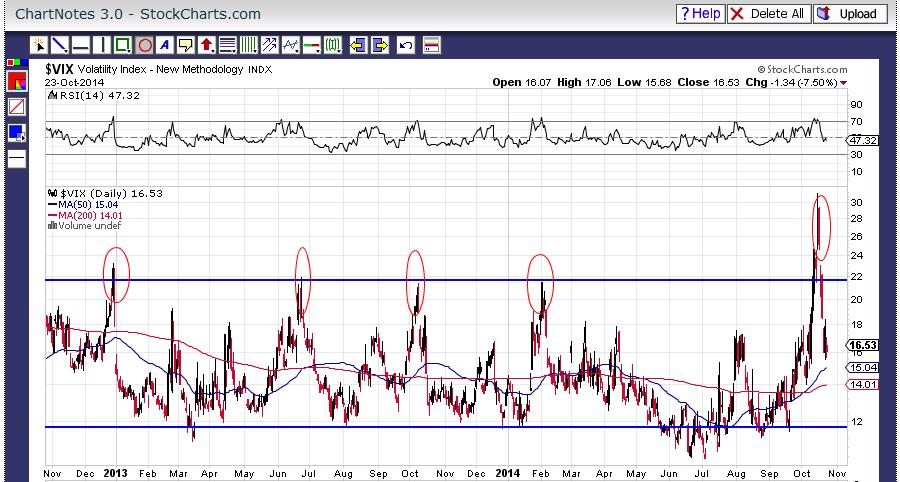
Another positive sign is the Volatility Index (VIX.) This is considered a contrarian indicator. There is a saying that reminds us of this fact. “When the VIX is high, it’s time to buy. When the VIX is low, it’s time to go.”
As you can see from the 5 circled items on the VIX chart, the first 4 represent high points or resistance and the last is the most recent peak. A high occurs on the VIX after a peak or resistance is met and it then rolls over. These represent buying opportunities. The circles are the 5 highest points for the VIX over the last 2 years. When you look at the S&P500 charts with its 5 circled items, those represent the 5 times the VIX said, “Time to buy.” Each buy occurred after a bit of a drop in the market. Each represented a good buying opportunity that was rewarded with a significant recovery in the market. Each time, the S&P climbed to new all time highs.

No comments yet.