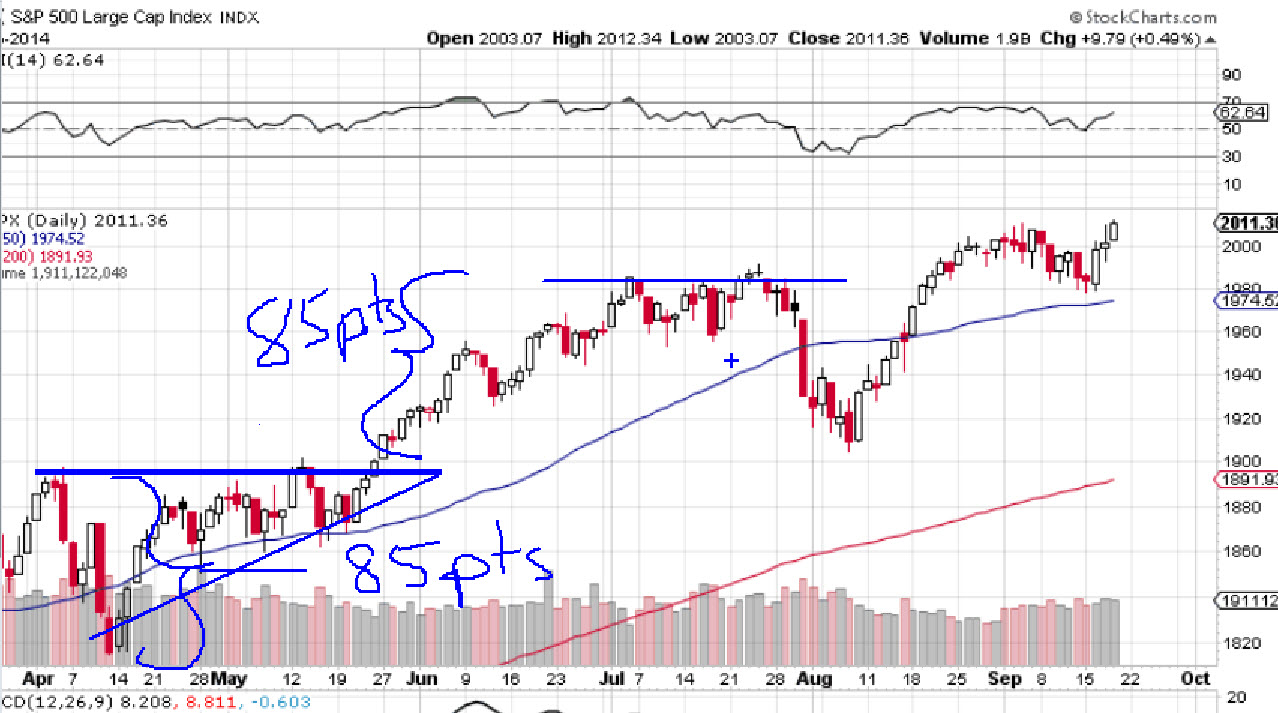
Below is a current chart of the S&P 500 index going back to April of this year. From a pure technical point of view, after the drop in April, the market started consolidating. During this consolidation, the market was hitting at a resistance level about 1900 over a period of several weeks. After the market hit resistance, it would come back down. However, every time it headed back down, it would not drop as far. It started to form an ascending triangle pattern.
In order to confirm an ascending triangle, we would need a break through the resistance at about 1900. No matter how much a move looks like a pattern, unless we receive the confirmation, there is no pattern. The break in resistance finally occurred towards the end of May. Once the confirmation occurred, we can now say that an ascending triangle pattern formed. An ascending triangle is a bullish pattern and we can now target an area of where the market could move.
Once a pattern is confirmed, we can estimate a potential target based on the distance at the widest point of the pattern. In this case, we are saying the low point was about 1815 and the high point at 1900 giving us an 85 point distance. This is the expected move of the market from the break in resistance at 1900. Our target now becomes 1985. The pattern formed over a period of about 6 weeks. This also gives us an approximate time frame for the bullish move to occur.
Sure enough, the market climbed just above 1985 on July 3rd and ultimately formed a resistance there. The move took about 6 weeks to occur. With patterns, we are looking at approximations. We are saying an expected move of about 85 in about 6 weeks. The move may have been a little more or less. The time may have taken a little longer or a little less. But, it’s a best guess and a good guess.

No comments yet.